Curriculum
R Tutorial | Learn R Programming Language
Learn R Programming Language
0/1R-Basics
0/5Fundamentals of R
0/5Variables
0/5Input and Output
0/3Data Structures
0/1Vectors
0/13-
R Vectors
 Text lesson
 -
Operations on Vectors in R
Text lesson
-
Append Operation on Vectors in R Programming
Text lesson
-
Types of Vectors in R Programming
Text lesson
-
Assigning Vectors in R Programming
Text lesson
-
Getting and Setting Length of the Vectors in R Programming – length() Function: Title change need
Text lesson
-
Creating a Vector of sequenced elements in R Programming – seq() Function
Text lesson
-
Get the Minimum and Maximum element of a Vector in R Programming – range() Function
Text lesson
-
Formatting Numbers and Strings in R Programming – format() Function
Text lesson
-
Replace the Elements of a Vector in R Programming – replace() Function
Text lesson
-
Sorting of a Vector in R Programming – sort() Function
Text lesson
-
Convert elements of a Vector to Strings in R Language – toString() Function
Text lesson
-
Extracting Substrings from a Character Vector in R Programming – substring() Function
Text lesson
Lists
0/10-
R – Lists
Text lesson
-
Two Dimensional List in R Programming
Text lesson
-
Operations on Lists in R Programming
Text lesson
-
List of Vectors in R
Text lesson
-
List of Dataframes in R
Text lesson
-
Named List in R Programming
Text lesson
-
Check if the Object is a List in R Programming – is.list() Function
Text lesson
-
Convert an Object to List in R Programming – as.list() Function
Text lesson
-
Apply a Function over a List of elements in R Programming – lapply() Function
Text lesson
-
Performing Operations on Multiple Lists simultaneously in R Programming – mapply() Function
Text lesson
Matrices
0/13-
R – Matrices
Text lesson
-
Create Matrix from Vectors in R
Text lesson
-
Operations on Matrices in R
Text lesson
-
Matrix Multiplication in R
Text lesson
-
Algebraic Operations on a Matrix in R
Text lesson
-
Combining Matrices in R
Text lesson
-
Matrix Transpose in R
Text lesson
-
Inverse of Matrix in R
Text lesson
-
Working with Sparse Matrices in R Programming
Text lesson
-
Convert an Object into a Matrix in R Programming – as.matrix() Function
Text lesson
-
Get or Set Dimensions of a Matrix in R Programming – dim() Function
Text lesson
-
Calculate Cumulative Sum of a Numeric Object in R Programming – cumsum() Function
Text lesson
-
Compute the Sum of Rows of a Matrix or Array in R Programming – rowSums Function
Text lesson
DataFrames
0/17-
R – Data Frames
Text lesson
-
Matrix vs Dataframe in R
Text lesson
-
DataFrame Operations in R
Text lesson
-
R – DataFrame Manipulation
Text lesson
-
Joining of Dataframes in R Programming
Text lesson
-
The Factor Issue in a DataFrame in R Programming
Text lesson
-
Data Reshaping in R Programming
Text lesson
-
Creating a Data Frame from Vectors in R Programming
Text lesson
-
Data Wrangling in R Programming – Data Transformation
Text lesson
-
Melting and Casting in R Programming
Text lesson
-
Subsetting in R Programming
Text lesson
-
Handling Missing Values in R Programming
Text lesson
-
Convert an Object to Data Frame in R Programming – as.data.frame() Function
Text lesson
-
Get the number of columns of an Object in R Programming – ncol() Function
Text lesson
-
Get the number of rows of an Object in R Programming – nrow() Function
Text lesson
-
sum() function in R
Text lesson
-
Create Subsets of a Data frame in R Programming – subset() Function
Text lesson
Arrays
0/8-
R – Array
Text lesson
-
Multidimensional Array in R
Text lesson
-
Array Operations in R Programming
Text lesson
-
Sorting of Arrays in R Programming
Text lesson
-
Convert values of an Object to Logical Vector in R Programming – as.logical() Function
Text lesson
-
Outer() Function in R
Text lesson
-
Intersection of Two Objects in R Programming – intersect() Function
Text lesson
-
Get Exclusive Elements between Two Objects in R Programming – setdiff() Function
Text lesson
Factors
0/7-
R Factors
Text lesson
-
Level Ordering of Factors in R Programming
Text lesson
-
Convert Factor to Numeric and Numeric to Factor in R Programming
Text lessonPreview
-
Check if a Factor is an Ordered Factor in R Programming – is.ordered() Function
Text lesson
-
Convert an Unordered Factor to an Ordered Factor in R Programming – as.ordered() Function
Text lesson
-
Checking if the Object is a Factor in R Programming – is.factor() Function
Text lesson
-
Convert a Vector into Factor in R Programming – as.factor() Function
Text lesson
Strings
0/10-
R Strings
Text lesson
-
Working with Text in R
Text lesson
-
String Manipulation in R
Text lesson
-
Concatenate Two Strings in R programming – paste() method
Text lesson
-
String Matching in R Programming
Text lesson
-
How to find SubString in R programming?
Text lesson
-
Finding the length of string in R programming – nchar() method
Text lesson
-
Convert string from lowercase to uppercase in R programming – toupper() function
Text lesson
-
Splitting Strings in R programming – strsplit() method
Text lesson
-
Print a Formatted string in R Programming – sprintf() Function
Text lesson
Decision Making
0/4Control Flow
0/8Functions
0/5Object Oriented Programming
0/15-
R – Object Oriented Programming
Text lesson
-
Classes in R Programming
Text lesson
-
R – Objects
Text lesson
-
Encapsulation in R Programming
Text lesson
-
Polymorphism in R Programming
Text lesson
-
R – Inheritance
Text lesson
-
Abstraction in R Programming
Text lesson
-
Looping over Objects in R Programming
Text lesson
-
R – Creating, Listing, and Deleting Objects in Memory
Text lesson
-
S3 class in R Programming
Text lesson
-
Explicit Coercion in R Programming
Text lesson
-
R6 Classes in R Programming
Text lesson
-
Getting attributes of Objects in R Language – attributes() and attr() Function
Text lesson
-
Get or Set names of Elements of an Object in R Programming – names() Function
Text lesson
-
Get the Minimum element of an Object in R Programming – min() Function
Text lesson
File Handling
0/5Packages in R
0/7-
Packages in R Programming
Text lesson
-
dplyr Package in R Programming
Text lesson
-
Data visualization with R and ggplot2
Text lesson
-
Grid and Lattice Packages in R Programming
Text lesson
-
Shiny Package in R Programming
Text lesson
-
tidyr Package in R Programming
Text lesson
-
What Are the Tidyverse Packages in R Language?
Text lesson
Data Interfaces
0/12-
Data Handling in R Programming
Text lesson
-
Importing Data in R Script
Text lesson
-
How To Import Data from a File in R Programming
Text lesson
-
Exporting Data from scripts in R Programming
Text lesson
-
Working with CSV files in R Programming
Text lesson
-
Working with XML Files in R Programming
Text lesson
-
Working with Excel Files in R Programming
Text lesson
-
Working with JSON Files in R Programming
Text lesson
-
Reading Tabular Data from files in R Programming
Text lesson
-
Working with Databases in R Programming
Text lesson
-
Database Connectivity with R Programming
Text lesson
-
Manipulate R Data Frames Using SQL
Text lesson
Error Handling
0/3Data Visualization
0/28-
Graph Plotting in R Programming
Text lesson
-
Graphical Models in R Programming
Text lesson
-
Getting started with Data Visualization in R
Text lesson
-
R – Charts and Graphs
Text lesson
-
Add Titles to a Graph in R Programming – title() Function
Text lesson
-
Adding Colors to Charts in R Programming
Text lesson
-
Adding Text to Plots in R programming – text() and mtext () Function
Text lesson
-
Adding axis to a Plot in R programming – axis () Function
Text lesson
-
Set or View the Graphics Palette in R Programming – palette() Function
Text lesson
-
Plotting of Data using Generic plots in R Programming – plot() Function
Text lesson
-
R – Bar Charts
Text lesson
-
R – Line Graphs
Text lesson
-
Adding Straight Lines to a Plot in R Programming – abline() Function
Text lesson
-
Addition of Lines to a Plot in R Programming – lines() Function
Text lesson
-
Histograms in R language
Text lesson
-
R – Pie Charts
Text lesson
-
Scatter plots in R Language
Text lesson
-
Create Dot Charts in R Programming – dotchart () Function
Text lesson
-
Boxplots in R Language
Text lesson
-
Stratified Boxplot in R Programming
Text lesson
-
Create a Heatmap in R Programming – heatmap() Function
Text lesson
-
R – Pareto Chart
Text lesson
-
R – Waffle Chart
Text lesson
-
Draw a Quantile-Quantile Plot in R Programming
Text lesson
-
Creating 3D Plots in R Programming – persp() Function
Text lesson
-
Describe Parts of a Chart in Graphical Form in R Programming – legend() Function
Text lesson
-
Principal Component Analysis with R Programming
Text lesson
-
Social Network Analysis Using R Programming
Text lesson
Statistics
0/33-
R – Statistics
Text lesson
-
Mean, Median and Mode in R Programming
Text lesson
-
Exploring Statistical Measures in R: Average, Variance, and Standard Deviation Explained
Text lesson
-
Homogeneity of Variance Test in R Programming
Text lesson
-
Covariance and Correlation in R Programming
Text lesson
-
Correlation Matrix in R Programming
Text lesson
-
Visualize correlation matrix using correlogram in R Programming
Text lesson
-
Distance Matrix by GPU in R Programming
Text lesson
-
Descriptive Analysis in R Programming
Text lesson
-
Normal Distribution in R
Text lesson
-
Binomial Distribution in R Programming
Text lesson
-
Compute the Negative Binomial Density in R Programming – dnbinom() Function
Text lesson
-
Poisson Functions in R Programming
Text lesson
-
ANOVA (Analysis of Variance) Test in R Programming
Text lesson
-
MANOVA Test in R Programming
Text lesson
-
Naive Bayes Classifier in R Programming
Text lesson
-
KNN Classifier in R Programming
Text lesson
-
Central Tendency in R Programming
Text lesson
-
Variability in R Programming
Text lesson
-
Skewness in R Programming
Text lesson
-
Absolute and Relative Frequency in R Programming
Text lesson
-
Permutation Hypothesis Test in R Programming
Text lesson
-
AB Testing With R Programming
Text lesson
-
Completely Randomized Design with R Programming
Text lesson
-
Randomized Block Design with R Programming
Text lesson
-
Bartlett’s Test in R Programming
Text lesson
-
Tree Entropy in R Programming
Text lesson
-
Tukey’s Five-number Summary in R Programming – fivenum() function
Text lesson
-
Compute Summary Statistics of Subsets in R Programming – aggregate() function
Text lesson
-
Hypothesis Testing in R Programming
Text lesson
-
Bootstrapping in R Programming
Text lesson
-
Time Series Analysis in R
Text lesson
-
T-Test Approach in R Programming
Text lesson
Machine Learning with R
0/19-
Introduction to Machine Learning in R
Text lesson
-
Setting up Environment for Machine Learning with R Programming
Text lesson
-
Supervised and Unsupervised Learning in R Programming
Text lesson
-
Classification in R Programming
Text lesson
-
Regression and its Types in R Programming
Text lesson
-
Regression Analysis in R Programming
Text lesson
-
T-Test Approach in R Programming
Text lesson
-
Decision Tree in R Programming
Text lesson
-
Random Forest Approach in R Programming
Text lesson
-
Root-Mean-Square Error in R Programming
Text lesson
-
Clustering in R Programming
Text lesson
-
Hierarchical Clustering in R Programming
Text lesson
-
DBScan Clustering in R Programming
Text lesson
-
Deep Learning in R Programming
Text lesson
-
Building a Simple Neural Network in R Programming
Text lesson
-
How Neural Networks are used for Regression in R Programming?
Text lesson
-
Multi Layered Neural Networks in R Programming
Text lesson
-
Survival Analysis in R
Text lesson
-
R – Stem and Leaf Plots
Text lesson
Convert Factor to Numeric and Numeric to Factor in R Programming
Factors are data structures that are implemented to categorize the data or represent categorical data and store it on multiple levels. They can be stored as integers with a corresponding label to every unique integer. Though factors may look similar to character vectors, they are integers, and care must be taken while using them as strings. The factor accepts only a restricted number of distinct values. It is helpful in categorizing data and storing it on multiple levels.
Converting Factors to Numeric Values
In R require to explicitly change factors to either numbers or text. To achieve this, one has to use the functions as.character() or as.numeric(). There are two steps for converting a factor to a numeric:
Step 1: Convert the data vector into a factor. The factor() command is used to create and modify factors in R.
Step 2: The factor is converted into a numeric vector using as.numeric(). When a factor is converted into a numeric vector, the numeric codes corresponding to the factor levels will be returned.
Example: Take a data vector ‘V’ consisting of directions and its factor will be converted into a numeric.
R
# Data Vector 'V'V = c("North", "South", "East", "East")# Convert vector 'V' into a factordrn <- factor(V)# Converting a factor into a numeric vectora1<-as.numeric(drn)a1is.numeric(a1) |
Output:
[1] 2 3 1 1

[1] TRUE
Converting a Factor that is a Number:
If the factor is a number, first convert it to a character vector and then to a numeric. If a factor is a character then you need not convert it to a character. And if you try converting an alphabet character to numeric it will return NA. Example:
Suppose we are taking the costs of soaps of the various brands which are numbers with value s(29, 28, 210, 28, 29).
R
# Creating a Factorsoap_cost <- factor(c(29, 28, 210, 28, 29))# Converting Factor to numerica1<-as.numeric(as.character(soap_cost))a1#chacking the variableis.numeric(a1) |
Output:
[1]  29  28 210  28  29

[1] TRUE
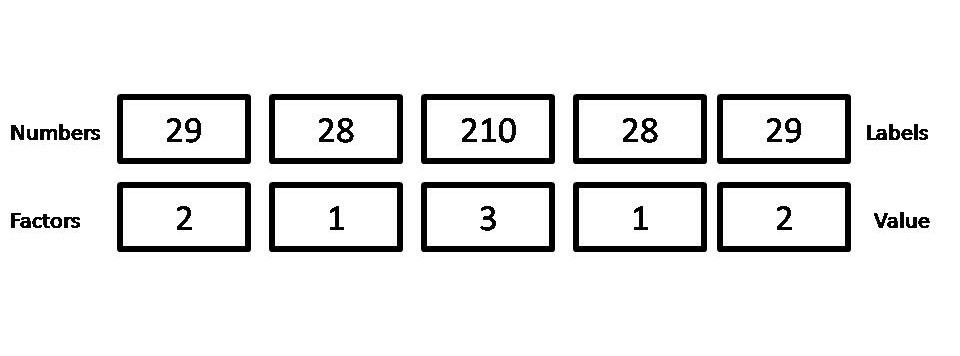 However, if you simply use as. numeric(), the output is a vector of the internal level representations of the factor and not the original values.
R
# Creating a Factorsoap_cost <- factor(c(29, 28, 210, 28, 29))# Converting Factor to Numerica1<-as.numeric(soap_cost)a1is.numeric(a1) |
Output:
[1] 2 1 3 1 2

[1] TRUE
Converting Numeric value to a Factor
For converting a numeric into a factor we use the cut() function. cut() divides the range of numeric vector(assume x) which is to be converted by cutting into intervals and codes its value (x) according to which interval they fall. Level one corresponds to the leftmost, level two corresponds to the next leftmost, and so on.
Syntax: cut.default(x, breaks, labels = NULL, include.lowest = FALSE, right = TRUE, dig.lab = 3)
where,
- When a number is given through the ‘break=’ argument, the output factor is created by the division of the range of variables into that number of equal-length intervals.
- In syntax include.lowest indicates whether an ‘x[i]’ which equals the lowest (for right= TRUE) break’s value should be included. And ‘right’ in the syntax indicates whether the intervals should be open on the left and closed on the right or vice versa.
- If labels are not provided then dig. lab is used. The number of digits used in formatting the break numbers is determined through it.
Example 1: Lets us assume an employee data set of age, salary, and gender. To create a factor corresponding to age with three equally spaced levels we can write in R as follows:
R
# Creating vectorsage <- c(40, 49, 48, 40, 67, 52, 53)salary <- c(103200, 106200, 150200, 10606, 10390, 14070, 10220)gender <- c("male", "male", "transgender", "female", "male", "female", "transgender")# Creating data frame named employeeemployee<- data.frame(age, salary, gender)# Creating a factor corresponding to age# with three equally spaced levelswfact = cut(employee$age, 3)table(wfact)is.factor(wfact) |
Output:
wfact
(40,49] (49,58] (58,67]
      4       2       1

[1] TRUE
Example 2: We will now put labels- young, medium, and aged.
R
# Creating vectorsage <- c(40, 49, 48, 40, 67, 52, 53)salary <- c(103200, 106200, 150200, 10606, 10390, 14070, 10220)gender <- c("male", "male", "transgender", "female", "male", "female", "transgender")# Creating data frame named employeeemployee<- data.frame(age, salary, gender)# Creating a factor corresponding to age with labelswfact = cut(employee$age, 3, labels=c('Young', 'Medium', 'Aged'))table(wfact)is.factor(wfact) |
Output:
wfact
 Young Medium   Aged
     4      2      1
[1] TRUE
The next examples will use ‘norm()‘ for generating multivariate normal distributed random variants within the specified space. There are three arguments given to rnorm():
- n: Number of random variables that need to be generated
- mean: Its value is 0 by default if not mentioned
- sd: standard deviation value needs to be mentioned otherwise it is 1 by default
Syntax:
norm(n, mean, sd)
R
# Generating a vector with random numbersy <- rnorm(100)# the output factor is created by the division# of the range of variables into pi/3*(-3:3)# 4 equal-length intervalsa1<-table(cut(y, breaks = pi/3*(-3:3)))a1is.numeric(a1) |
Output:
(-3.14,-2.09] (-2.09,-1.05]     (-1.05,0]      (0,1.05]   (1.05,2.09]   (2.09,3.14]
            0            10            39            31            19             1
[1] TRUE
The output factor is created by the division of the range of variables into 5 equal-length intervals through break argument.
R
age <- c(40, 49, 48, 40, 67, 52, 53)gender <- c("male", "male", "transgender", "female", "male", "female", "transgender")# Data frame generated from the above vectorsemployee<- data.frame(age, gender)# the output factor is created by the division# of the range of variables into 5 equal-length intervalswfact = cut(employee$age, breaks=5)table(wfact) |
Output:
wfact
  (40,45.4] (45.4,50.8] (50.8,56.2] (56.2,61.6]   (61.6,67]
          2           2           2           0           1
R
y <- rnorm(100)table(cut(y, breaks = pi/3*(-3:3), dig.lab=5)) |
Output:
(-3.1416,-2.0944] (-2.0944,-1.0472]       (-1.0472,0]        (0,1.0472]
                5                13                33                28
  (1.0472,2.0944]   (2.0944,3.1416]
               19                 2